Unconventional resource plays, like shale gas has become an important source of natural gas, especially in North America, and with this the need of better characterize these reservoirs, improve reserves estimations, production efficiency, and mitigate associated risks.
This post illustrates some aspects of the petrophysical characterization of a shale gas well by integrating the available logs and lab measurements form drilling cuttings, and its not intended to be an extensive article with all the technical details.
1. Mineralogy and TOC Calibration
The right calibration of mineralogy and organic content is essential to properly compute porosity and for therefore hydrocarbon content in shale resource plays.
In the example presented below the mineralogy computed from a multimineral probabilistic model is calibrated against XRD, QEM scan, and Chemostrat measurements performed on drilling cuttings.
“QEMSCAN® is an automated petrography system based around a scanning electron microscope (SEM). The addition of Energy-dispersive X-ray (EDX) spectroscopy detectors and an extensive mineral database enables the identification of minerals and other compounds in-situ”.
CHEMOSTRAT® provides elemental, mineralogical, and organic geochemical data. “The technique relies upon the fact that even apparently homogenous sediments show changes in their chemical composition, these changes reflecting minor fluctuations in variables such as sediment source, facies, palaeoenvironment, palaeoclimate and diagenesis”.
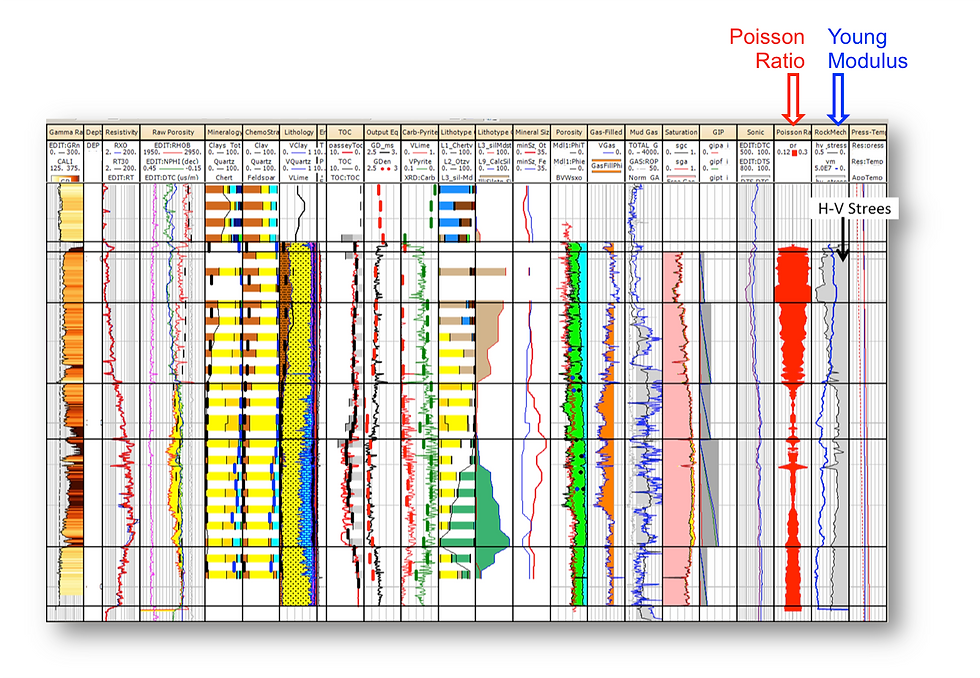
Tracks 5 and 6 in figure below show the QEMSCAN and CHEMOSTRAT computed mineralogy in colors. The black dots correspond to the XRD total clay volume. Track 7 shows the multimineral model results.
In track 8, 9 and 10 is presented the calibration of TOC, grain density, and pyrite / carbonates content (TOC was modeled using the Passey technique).

2. Porosity and Gas-Filled Porosity Calculation
The calibrated probabilistic model generates a porosity based on multimineral matrix properties. This porosity must be consistent with all the logs including Density, Neutron, Sonic, and PEF.
In the last 3 tracks in picture below, it can be observed that the Computed porosity matches reasonably the NMR measurement and that the Gas-Filled Porosity has good visual correlation to the mud logging gas shows.

3. Free and Adsorbed Gas Calculation / Gas in-Place (GIP)
Previous steps show how the Mineralogy, TOC, and Phi calibration. For the Water Saturation calculation Dean Stark data is not available and the log-analysis based method used has been calibrated to core derived ‘adsorbed’ and ‘free gas’ from desorption work done on an analog field.
The Isotherm parameters used to compute the adsorbed gas are:
· gsLo=25 scc/g
· pL=10,000 kpaa

4. Mechanical Rock Properties
Best intervals in the reservoir (lower clay content, higher TOC and gas-filled porosity, higher OGIP) correspond with more favorable mechanical rock properties (Lower Poisson Ratio, Higher Young Modulus, Lower Horizontal to Vertical Stress).

5. Chemo-stratigraphic description: depositional conditions
CHEMOSTRAT® provides elemental, mineralogical, and organic geochemical data allowing to ‘chemically zone’ the reservoir to relate to depositional processes. Think Biogenic (Clean) vs. Terrestrial Derived Sediments (Clays).
• Biogenic & Anoxic Zonation
• Mineral Match
• TOC match

6. QemScan Petrograohy description: lithotypes zonation / mineral size
The automated petrography system based around a scanning electron microscope (SEM) by QEMSCAN® outputs a modal mineralogy profile with mineral association and grain morphology.
• Lithotype Zonation
• Mineralogy
• Synthetic Parameters (Bulk density, Grain Density)
• Particle Size

7. SEM Imaging
Best reservoir intervals seem to be well sorted, with recrystallized textures, overgrowths, and intra TOC Porosity.

8. Integrated rock Characterization / description
The figure below shows the detailed geological characterization of the reservoir including several parameters that can’t be inferred from logs.

Proper use and integration of these results helped improving reserves estimations, well completion and production efficiency, and mitigate associated risks.

Commenti